 26
26
Feb - 2018Real Time Systems
5 min | 27042Table of contentShowThe last week I was working on a real-time application (with a 1 ms sample time) that runs on an ARMv8 Cortex-A53 (Raspberry Pi 3 Model B based board) and I was wondering the differences between latencies on the standard and the Real-Time (RT) Linux kernel. I had some problems with the standard kernel version, then I thought I could analyze the latencies of both kernels, and make some conclusions. Many test are available but with older kernel versions. The tests were performed using the Raspbian Kernel 4.14.21 and the Preempt-RT Patch 4.14.21-rt17!
Hardware & Software
To follow the DIY parts, you need the following setup:
RT-Tests
I found the suite RT-Tests provided by the Real-Time Linux project in order to test the latency of a system. I did a basic experiment measuring the cycle latency of the Raspberry Pi 3 with Kernel 4.14.21 using a Standard and a patched Preempt-RT kernel.
The RT-Tests suite basically measures the time needed to respond to an interrupt, and in the cycle program of the suite, this interrupt is generated by a timer. On a real-time system, the interruption response latency should be predictable, and the distribution and the maximum latency are very important. In my case, I am periodically sampling a changing bus system, and I do not want to miss bus data, or get data duplicated because the data sampling is not performed on time, or two data sampling are performed faster than the changes on the bus system.
Installing Raspbian
I am not going to explain this in this post, there are many links that can help you with this like this one:INSTALLING OPERATING SYSTEM IMAGES.
I included the direct link to the latest Raspian-Lite image in the Hardware & Software section. Use this version (Lite) if you do not need the PIXEL Desktop.
If you do not want to connect a monitor to activate the ssh service, then mount the Micro SD card after you write the image, and create a new file named
sshon the partition calledboot. That's right, onlysshwithout extension or/and content. Booting the Raspberry Pi with this file, activates the ssh service.Kernel Patch
Check this link!
RT-Tests suite
Compile Tools
Let's start with the RT-Tests suite. To get the cycle test program included in the RT-Tests suite, you need to clone and compile the rt-tests repo. The suite needs the
build-essentialpackage in order to be compiled in Raspbian/Debian.sudo apt-get install -y build-essential # if you are using the Raspbian lite, # you need to install git: sudo apt-get install -y git git clone git://git.kernel.org/pub/scm/utils/rt-tests/rt-tests.git cd rt-tests git checkout stable/v1.0 make all -j4 sudo make installYou need to check out the
stable/v1.0branch to build the project. If you want to only compile the cyclictest, just replacemake all -j4withmake cyclictest.Run Tests
A lot of people are using the mklatencyplot bash script of OSADL to measure the latency and generate some plots. The script needs the
gnuplotlibrary, which needs about 139 libraries and 331 MB of additional disk space. I am using Raspbian-Lite because I really want a small image. Then, I took only the first lines of the code to get the test running and for the plots, I used some Python. The cyclic test runs with the following parameters:sudo cyclictest -l50000000 -m -S -p90 -i200 -h400 -q > output.txt(use
sudo(super user) otherwise you getunable to change scheduling policy! either run as root or join realtime group)-l50000000: 50M iterations (about 2.5 hours!);-m: lock current and future memory allocations (prevent being paged out?)-S: Standard SMP testing: options -a -t -n and same priority of all threads (Raspberry Pi has 4 Cores then 4 Threads)-p90: priority of highest prio thread set to 90 (for the 4 threads, then: 90 89 88 87)-i200: interval for the first thread (in us).-h1000: dump histogram for max latency (up to 1000us).-q: print a summary only on exit.
More options are available typing
cyclictest --helpor here.After the test concludes, you get the file
output.txtwith the results. Typing the following:grep -v -e "^#" -e "^$" output.txt | tr " " "," | tr "\t" "," >histogram.csv sed -i '1s/^/time,core1,core2,core3,core4\n /' histogram.csvyou grip the data lines, remove empty lines and create a comma-separated values file (.csv).
This data can be used with Python to make some analysis and plots.
Temperature
The temperature is an important factor on the performance of the Raspberry Pi (and on every system). I read the following 'white paper' from the RevPi people that did some tests on the ambient temperature influence on the overall system performance. The results were the following:
There should be no cutbacks of compute power at ambient temperatures under 20°C
At 25°C ambient temperature 3 cores may run with full clock speed while with 4 cores the clock frequency is lowered from 1.2 to 1.1 GHz after 10 to 20 minutes of full stress.
At 40°C ambient temperature 4 cores under full stress will still work with 1 GHz while stressing just 1 core results in no down clocking.
At 50°C ambient temperature 4 fully stressed cores are running at average 0.7 GHz, having short down clockings to 0.6 GHz and short up clockings to 0.9 GHz. ,1 core under full stress does result in no down clocking.
At 65°C ambient temperature and either 4 or 1 core under full stress results in an “emergency mode” with just 0.4 GHz, after longer periods even 0.3 GHz.
Reference: RevPi.
Obviously, the results were only considering changes in the ambient temperature. But you can see, that the temperature can achieve a lot of unwanted changes on the system performance.
In my case, I measured the CPU and GPU temperatures to see if they remained constant during the test, and between the tests with standard and RT kernels. To do that I used the following code:
#!/bin/bash

while true
do
  cpuTemp0=$(cat /sys/class/thermal/thermal_zone0/temp)
  cpuTemp1=$(($cpuTemp0/1000))
  cpuTemp2=$(($cpuTemp0/100))
  cpuTempM=$(($cpuTemp2 %$cpuTemp1))
  clear
  echo "CPU temp=$cpuTemp1.$cpuTempM'C"
  echo "GPU $(/opt/vc/bin/vcgencmd measure_temp)"
  sleep 5
done
Experimental Results
The results of this article are outdated! I wrote the following new articles analyzing the kernel performance:
- Latency Performance
- Kernel CPU & Network PerformanceTemperature
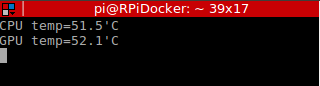
With an ambient temperature of near 20°C and using the Standard Raspbian kernel, the GPU and CPU temperatures remained in the scope of 53.0°C ± 2.5°C. The temperatures of the Preempt-RT kernel were slightly higher in the scope of 55°C ± 5.5°C. However, this should not influence the system overall performance.
![Temperature RPi with Std Kernel]()
Fig. 1: Example of measured temperatures
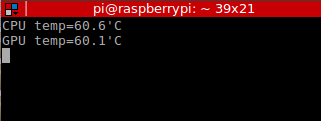
during latency tests on standard Raspbian kernel (4.14.21-v7+)![Temperature RPi with Std Kernel]()
Fig 1: Example of measured temperatures
during latency tests on Preempt-RT Raspbian kernel (4.14.21-rt17-v7+)Latency
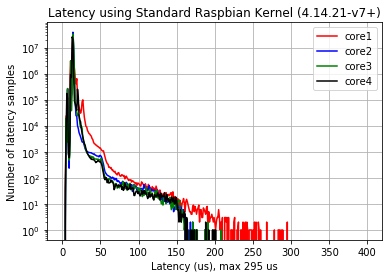
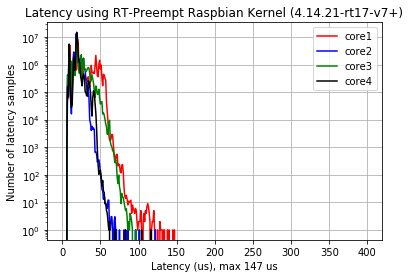
Fig. 2 (a) shows the latency using the Standard Raspbian kernel, the maximal latency reaches 295 us. Fig. 2 (b) shows the latency using the Preempt-RT Raspbian kernel, the maximal latency is reduced to 147 us (factor ~0.5). The core 1 defined this maximum for both configurations. The maxima is for Std-Raspbian kernel about 14 us, while for Preempt-RT is 16 us (strange)! Comparing the results with the ones obtained using kernel 4.9, the standard kernel and Preempt-RT kernel 4.14.21 perform worse!
![Raspberry PI Model 3: Latency using Std Raspbian Kernel]()
![Raspberry PI Model 3: Latency using RT-Preempt Raspbian Kernel]()
Fig. 2 (a): Latencies Using Std Raspbian Kernel (4.14.21-v7+). (b): Latencies Using Preempt-RT Raspbian Kernel (4.14.21-rt17-v7+). To sum up, applications needing an accurate timer of below 500 us are safe with both kernels, but with Preempt-RT the safety factor is greater!
I'll be using the Preempt-RT version!(updated 26.02.2018) (read Performance!)Performance! (updated 26.02.2018)
I found a problem on the patched kernel, and I thing the problem is in every Preempt-RT Raspbian versions. The IRQ/39-dwc_otg process uses more than 30% of the CPU! That is too much! The interruption is related with the USB irq: A known problem of the Preempt-RT patches. I read that the option
dwg_otg.speed=1in/boot/cmdline.txtshould mitigate the problem, but It didn't work.![RT Kernel IRQ Processes]()
Fig. 3: 3 IRQ/39-dwc_otg processes use more that 30% of the CPU! If you have another solution to this problem, write a comment!
We use cookies to improve our services. Read more about how we use cookies and how you can refuse them.


")

")


")
arquolo 05.26.2018
Try to apply this patch, I used it on 4.9 kernel and it helps then:https://www.osadl.org/monitoring/patches/rbs3s/usb-dwc_otg-fix-system-lockup-when-interrupts-are-threaded.patch